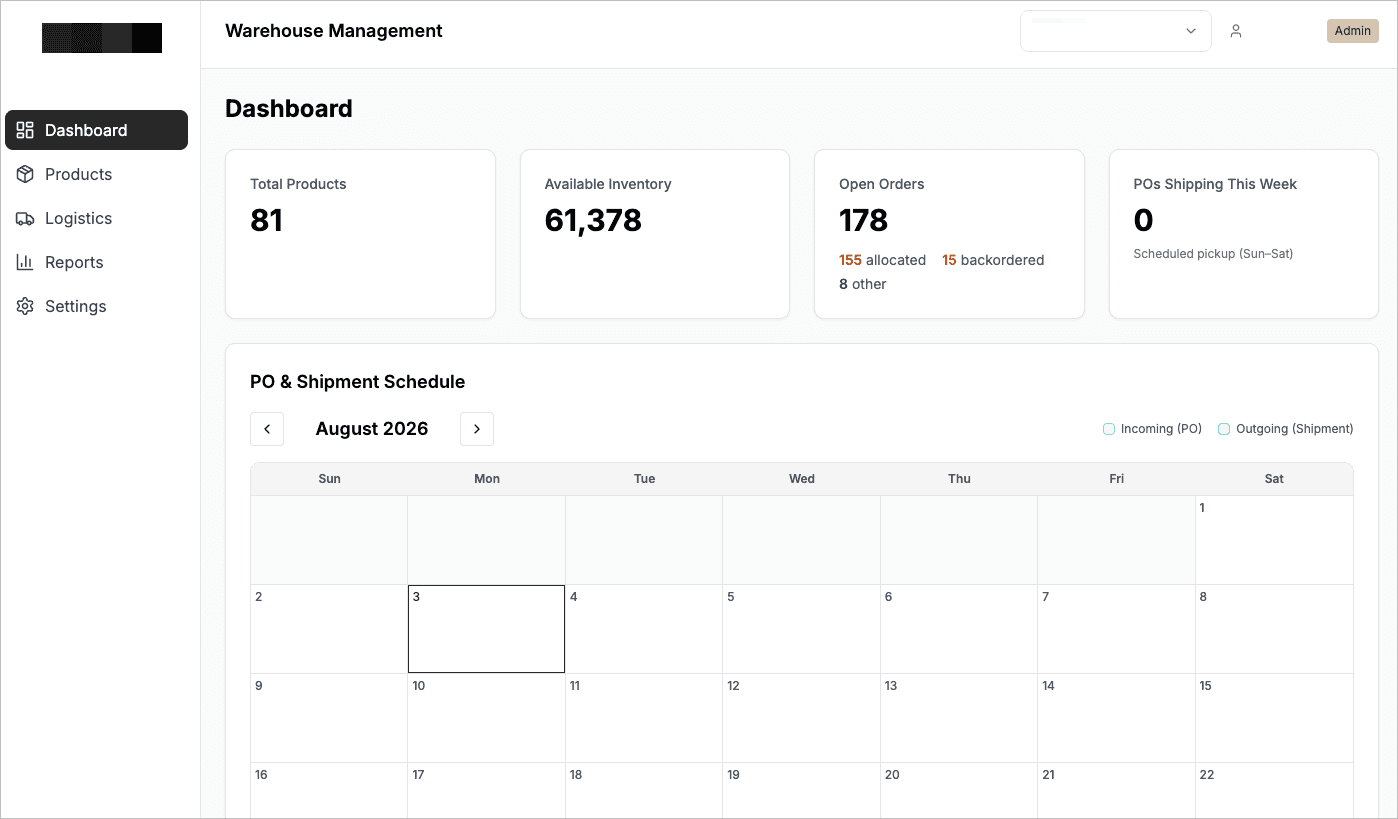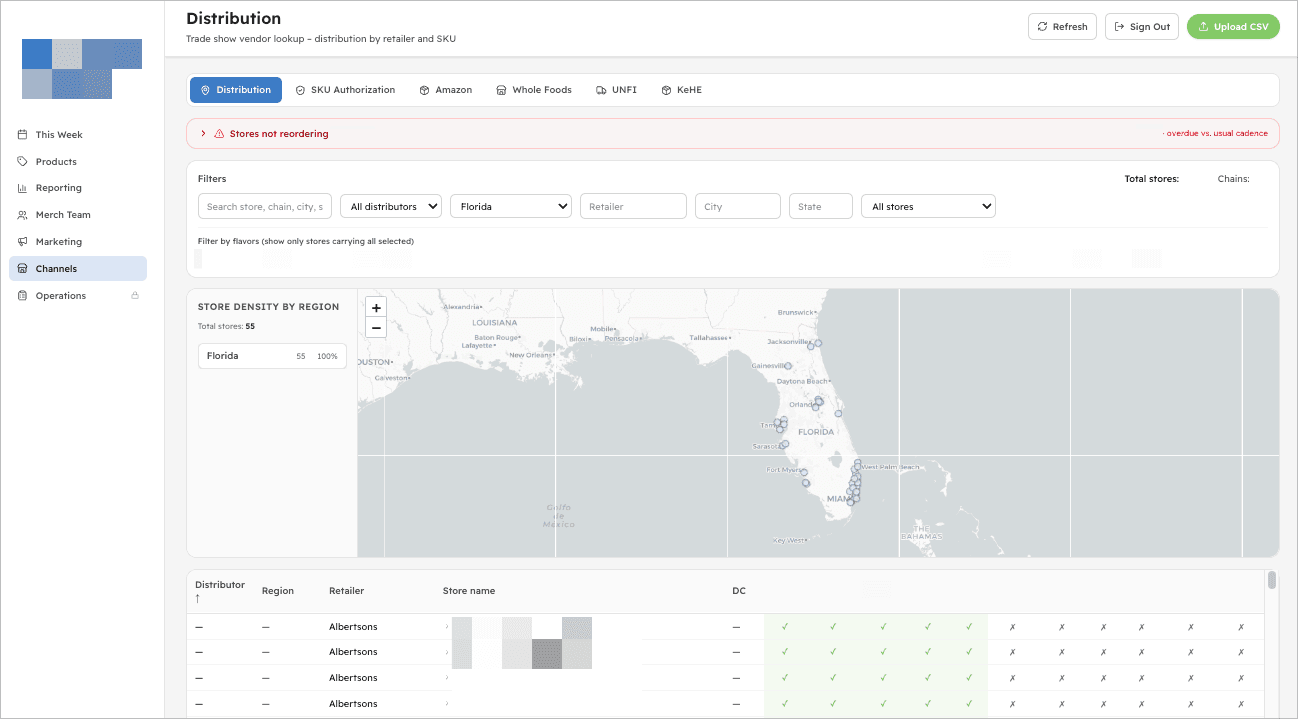
Distro-first (grocery and retail). I built a custom analytics dashboard from scratch that pulls distributor and syndicated data (KeHE, UNFI, SPINS, Nielsen) into one easy-to-digest view, then wired it into the field merchandising reps and influencer marketing team so they can submit orders and request merch on demand.
- Supabase
- Vercel
- SQL
- Cursor AI
- Superhuman
- Sunsama
- Slack
- Google Suite
- Excel
- Granola
- Raycast
- PowerPoint
- Notion
- Notion Calendar
- 1Password
- GitHub
- Amazon Seller
- Faire
- ShipStation
- Custom Dashboards
The Custom Dashboard
The situation. Every Monday started with four-plus hours of copying numbers out of KeHE, UNFI, SPINS, and Nielsen into spreadsheets by hand. By the time the report was done it was already stale, and nobody trusted it enough to move fast.
What I saw. The problem wasn't the reporting. It was that the data lived in five places that never talked to each other. A bigger reporting tool wouldn't fix that. The team needed one source of truth built around how they actually sell.
What I built. A custom analytics dashboard from scratch, on Supabase, Vercel, and SQL, that pulls every distributor and syndicated feed into one view that updates itself. Then I wired it into the field merchandising reps and the influencer team so they can submit orders and request merch from the same place they see the numbers.
The outcome. Four hours of manual reporting, gone. The team makes calls off live data instead of last week's guess. Next, I'm turning the same approach into a production planning app so forecasting stops living in spreadsheets too.